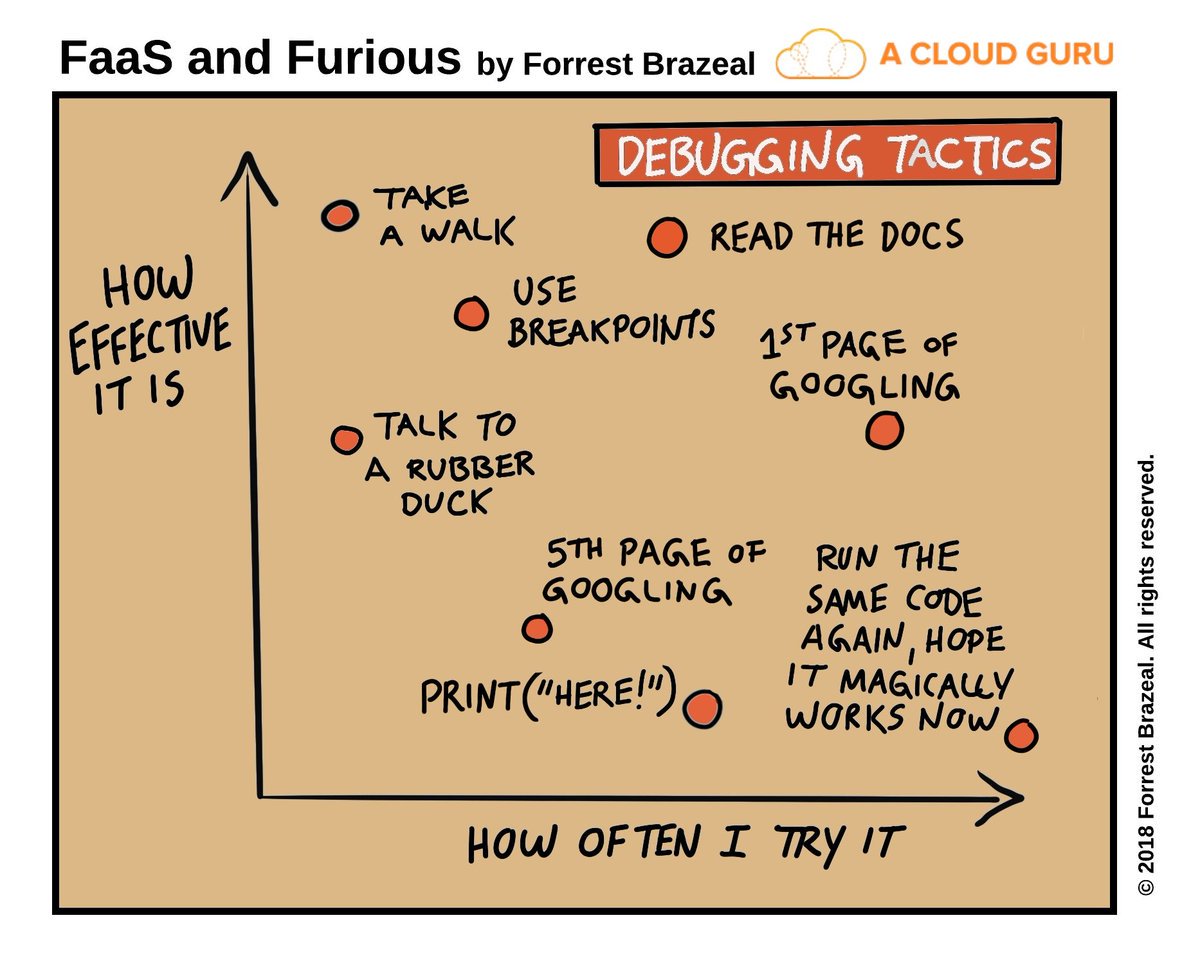
You’ve written a test, you run it, you think it should work, but it doesn’t. What can you do?
- Pause browser execution
- Inspect variables and elements
- Manually run the steps

Pause browser execution
An easy way to debug is to run the test with a pause in it, so you can view whether an element is really visible, you can inspect the element, you can see if an element is actually overlapped, etc.
You simply add browser.pause(30000) on a line above the command that’s not doing what you want it to do, and run the test. You can replace 30000 with however many milliseconds you think you’ll need.
Inspect variables and elements
You can use console.log() to show the contents of variables and other useful things whilst it’s running through the test steps. For example:
console.log(searchBar)shows what’s in variablesearchBarif it has been defined. If the variable represents a selector, it will also output what the selector is defined as, and all the properties of the browser object including session id and capabilities.console.log(typeof searchBar)shows what the datatype is of variablesearchBar. If the variable represents a selector, it should outputobject.
This output will get lost in all the other output if you use the default log level (which is very verbose). To change that, go into your wdio.conf.js
and change the logLevel setting from info (or whatever you have it set to) to error. Now on running tests you’ll see only the test output, the
most important potential problems, and your console.log output.
Manually run the steps
You could open your browser to simulate the steps you’ve written, but it wouldn’t be the same as running it within a chromedriver instance via
WebDriver and with the wdio.conf.js capabilities. Good news! We can do the latter manually as well.
Open your package.json. The scripts section probably looks something like:
"scripts": {
  "test": "wdio wdio.conf.js",
},
Change it to:
"scripts": {
  "test": "wdio wdio.conf.js",
  "debug": "wdio repl chrome"
},
This means that in the console we can run npm run debug and it will open a chromedriver instance which is configured and run exactly as it
would run during our tests. The beautiful thing is you can now run wdio commands in your console shell. For example, try browser.url ('https://www.google.co.uk'). You can run all your test steps against the browser instance that opens.