The Simple Shapes of Stories
Inspired by a short lecture by Kurt Vonnegut on the shapes of stories, I decided to graph the general mood in well-known stories.
I wrote a simple parser (using Python + NLTK) which evaluates a given text based on two collections of keywords, one collection of words indicating a positive, up-beat tone and the other collection indicating a negative, dramatic tone. I then graphed the results.
Let’s start by looking at fairy tales:
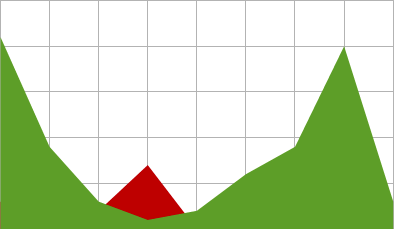
Hansel and Gretel by the brothers Grimm
As you can see, a negative mood prevails at the start of the story. It’s a poor household and a terrible plan is hatched. Hansel and Gretel are abandoned, twice, but Hansel is optimistic and pragmatic. Things don’t look too bad. However, they grow increasingly hungry and tired, and if that wasn’t bad enough they meet an old woman who prefers to eat children rather than sweets. However, everyone lived happily ever after. Except (spoiler alert) the witch. And (spoiler alert) the mother.
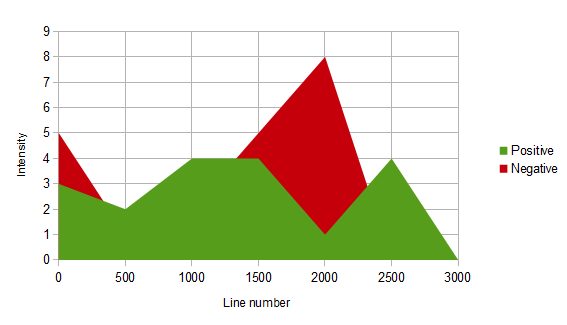
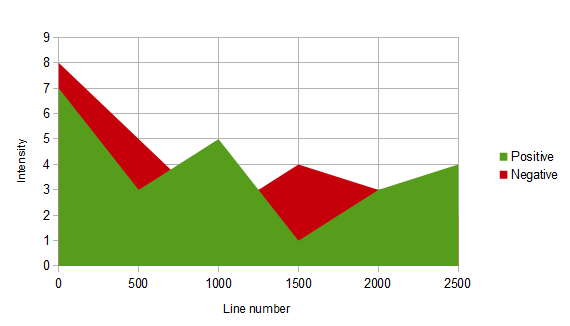
Little Red Riding Hood – the version by the brothers Grimm
This graph doesn’t work as well, since it is a very short story, but is fairly accurate. The reason the negativity doesn’t appear until the end is because Little Red Riding Hood is happily on her way to her grandmother, with the only outspoken drama when the wolf “ate her up”, which does not trigger my parser. Only towards the end do the horrors come out in the open.
Let’s take a quick detour to larger stories before revisiting fairy tales in a comparison of Disney and the original versions.
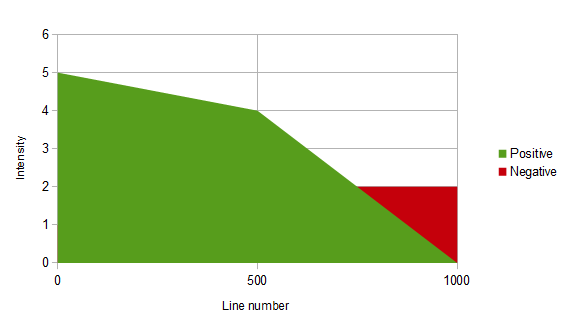
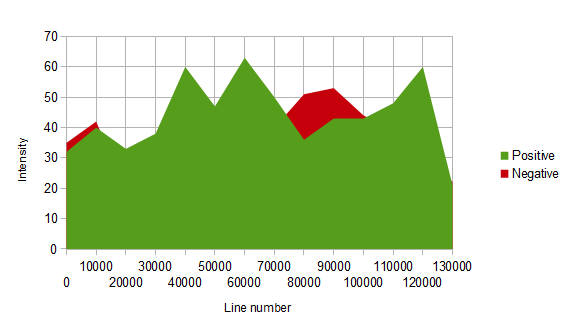
Pride and Prejudice by Jane Austen
Pride and Prejudice would have looked like a thoroughly up-beat story if we hadn't lifted the veil of positivity to reveal the darkness underneath.
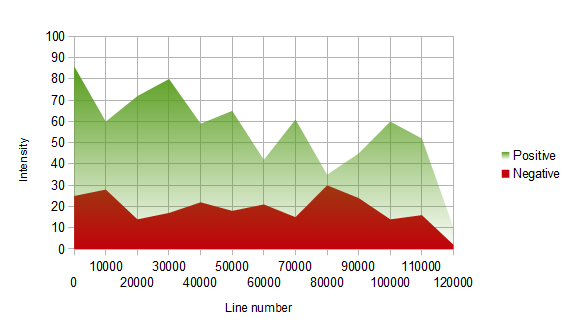
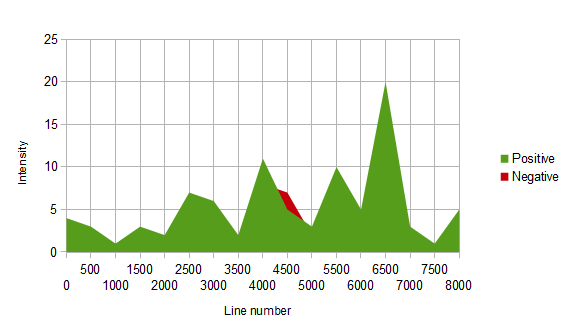
A Tale of Two Cities by Charles Dickens
Accurate? I haven’t read the novel, but the plot is far darker than this graph indicates. Perhaps Dickens uses a vocabulary which is not well covered by the collections of words I’ve used.
Now, let’s move from Dickens to Disney.
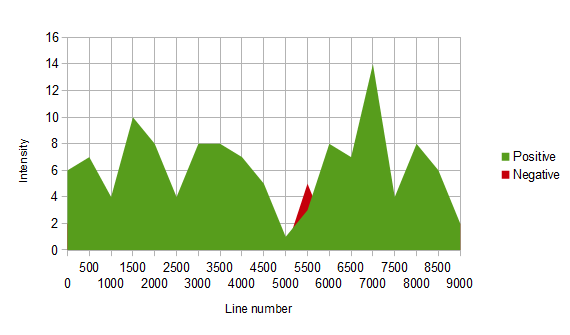
The Little Mermaid (transcript of the Disney animation, 1989)
Something terrible peeking up in the middle there. Now let’s compare this to the original, which is supposed to be rather more brutal.
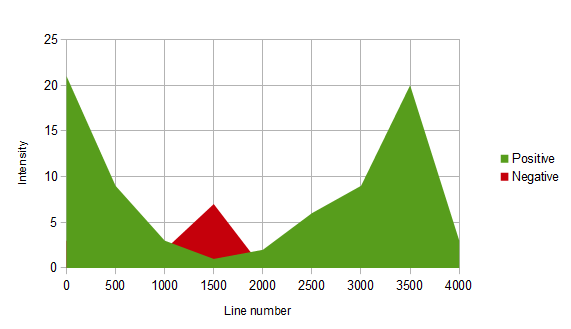
The Little Mermaid by Hans Christian Andersen
Strikingly similar.
Snow White (transcript of the Disney animation, 1937)
Disney’s version has a very clear and simple story arc much like Vonnegut’s first graph in his lecture.
Snow White (by the brothers Grimm)
A significant difference. Grimm’s version is balanced and, well, more grim compared to the Disney script, though still leading to a happy end.