Visualising garden colours using R
As a data visualisation hobby project, I chose to visualise the changing of colours in our back garden.
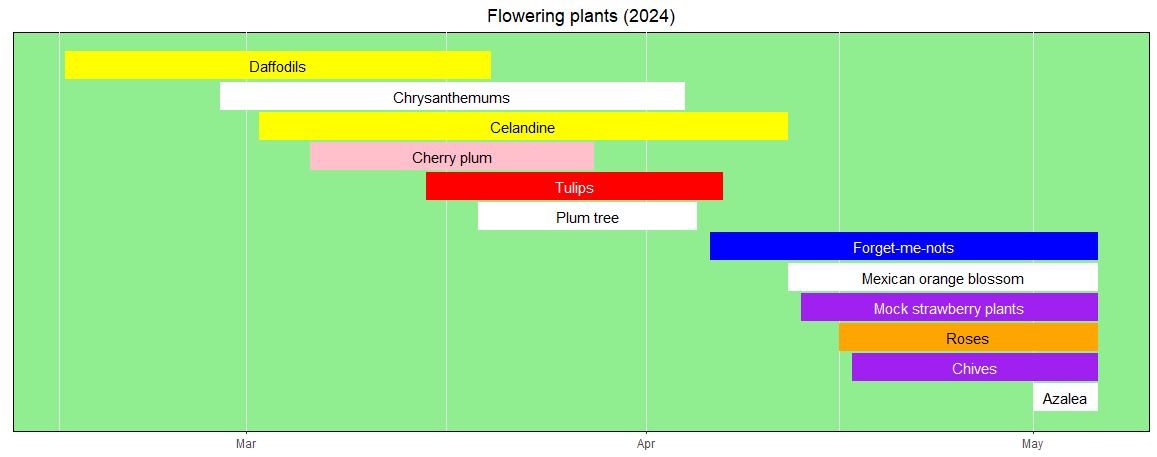
This project's header image shows the result to date.
What I did:
- Track the start and end date for the flowering of plants in our back garden
- Create a CSV file with columns: Name (Dutch), Name (English), Colour, Font colour, Start date, End date
- In Rstudio, write an R script to:
- Read the CSV (parsing the dates as dates) using
readr - Create a timeline graph using
ggplot2andvistime
- Read the CSV (parsing the dates as dates) using
- Run the R script
- Export the graph as an image
Choices:
- Distinguish the white flowers by rendering them on a green background
- Ensure enough font contrast by including the font colour in the CSV
Script:
library(readr)
library(ggplot2)
library(vistime)

blossom <- read_csv("Flowering_Plants_2024.csv",
                    col_types = cols(`Start date` = col_date(format = "%d/%m/%y"),
                                     `End date` = col_date(format = "%d/%m/%y")))

p <- gg_vistime(
  blossom,
  col.event = "Name (English)",
  col.start = "Start date",
  col.end = "End date",
  col.color = "Colour",
  col.fontcolor = "Font colour",
  optimize_y = FALSE,
  linewidth = 10,
  title = "Flowering plants (2024)",
  show_labels = TRUE,
  background_lines = NULL
)

p + theme(panel.background = element_rect(fill='lightgreen'))